Skip Navigation
Falvey Library
Advanced
You are exploring: Home > Blogs

Geography Awareness Week: Geography Careers in Municipal Government

Photo by Antoni Shkraba: https://www.pexels.com/photo/close-up-photo-of-a-person-holding-a-tablet-computer-showing-the-world-map-5306430/

Recognizing that young Americans have a gap in their understanding of geography and their roles as global citizens, National Geographic helped create Geography Awareness Week, raising awareness to this gap in American education. Also, the hope is to excite people about geography as both a discipline and as a part of everyday life.

To celebrate Geography Awareness Week, Falvey Library and the Department of Geography and the Environment (GEV) invite you to attend this week’s geography-focused events, to check out our list of Geographic Information Systems (GIS) projects below, and to follow along with Falvey’s blogs sharing projects and discussions from GEV’s students and alumni.


Kate Homet

Kate Homet ’22 MS, Environmental Planner, N.H.


Geography students, don’t be afraid to give a job in the public sector a try, especially if you’re itching for a job that will make a difference for both you and your community.

When you hear the word sustainability, it probably brings to mind a lot of different subjects. You can associate it with the environment, corporations, food, culture, the economy, transportation, etc. When you hear GIS or Geographic Information Systems, do you associate it in the same way as you might with sustainability? If you don’t, it’s time to start.

While you may be used to seeing and using it for your environmental science analyses, you can also see it being used every day for things like public health dashboards, crime, gerrymandering, political, and immigration maps, for navigation and national security. There are so many sectors that use GIS in their day-to-day work that it has become impossible not to see its impacts in your everyday life.

When I graduated from the GEV master’s program back in 2022, I was pretty nervous to enter into a career in the public sector. I was doubtful that there would be opportunities to use my ESRI or remote sensing skills, and I really didn’t want all of my excitement and passion for GIS to fade away in a position that wasn’t titled “GIS Analyst” or “Environmental Scientist”. But pretty soon after stepping into my new role of Environmental Planner with the City of Portsmouth, I had already compiled a massive list of projects that I could do using GIS, both term and long-term.

What a lot of people don’t tell you about jobs in municipal government is that they are full of opportunity. Not just for individual growth or promotions, but being a part of local government gives you a chance for engagement on all levels. As a local environmental planner, I apply for federal grants, work with state officials on environmental issues or funding for projects, and go out into the community and work alongside residents, local businesses and universities to better my community.

Although my specialty is GIS and environmental science, I also have the opportunity to learn and work with other city departments on a regular basis doing engineering, stormwater, building inspections, health, zoning enforcement, assessing, and policing. While these departments don’t even begin to cover all of the professionals I work with every day, they have a lot in common: they show how extremely useful GIS is to their growth and success.

As someone with that background and that knowledge of GIS, I have the privilege of being able to teach those skills to the people in my community who need it the most. In turn, I’m able to gain lifelong skills and training on a variety of useful topics that will help me to grow and advance in my career.

What more could you ask for?

Follow the blog and social for more Geography Awareness Week posts and events!


Like

Geography Awareness Week: Why is Geography Useful?

Photo by Pixabay from Pexels: https://www.pexels.com/photo/map-atlas-south-america-52502/

Recognizing that young Americans have a gap in their understanding of geography and their roles as global citizens, National Geographic helped create Geography Awareness Week, raising awareness to this gap in American education. Also, the hope is to excite people about geography as both a discipline and as a part of everyday life.

To celebrate Geography Awareness Week, Falvey Library and the Department of Geography and the Environment (GEV) invite you to attend this week’s geography-focused events, to check out our list of Geographic Information Systems (GIS) projects below, and to follow along with Falvey’s blogs sharing projects and discussions from GEV’s students and alumni.


Meghan Conway

Meghan Conway ’20 CLAS, Environmental, Social, and Governance Research Analyst, Orrick, Herrington & Sutcliffe


GIS is not only useful for scientists, but is also incredibly useful for business professionals, especially in the banking, insurance, and investment worlds.

I work in the Environmental, Social, and Governance (ESG) space, identifying areas for corporates to enhance their ESG-related public disclosure, internal processes, and build enterprise value. And, for me and for others in my industry, GIS can be a quick risk-screening tool, without getting too much into the weeds.

Small and large companies alike may want to consider regional risks around social concerns, such as child labor and forced labor, and environmental risks, such as water quality and air pollution, both in their supply chain and closer to home. Incidents related to these topics (i.e., worker strikes, human rights violations, lack of usable water, or health problems in local communities) are not only important for the company to consider in terms of the social right to operate, but these events could materially affect business continuity and the larger supply chain.

Climate risk is seen as one of the most important considerations for a lot of corporates, especially with new regulatory obligations that require the disclosure of climate risks and opportunities (i.e., California Climate Rule, the U.S. Securities and Exchange Commission’s proposed Climate Disclosure Rule, Corporate Sustainability Reporting Directive in the European Union). For this reason, many companies have started to enhance their internal governance mechanisms with respect to climate, with many of them referencing online GIS platforms to understand and sufficiently manage their risk.

In addition to this, climate justice is also seen as an important consideration for a lot of governments; with its explicit tie to the local geography, environmental justice tools have popped up at the regulatory-level and the state-level.

Below is a list of some of my favorite GIS tools to reference to quickly gauge a company’s risk in these areas; the data used for these tools is often public and downloading/piloting this data is a great way to delve a little deeper. Please note that the results given by these tools are not concrete and can only point us in the right direction; these issues are highly complex and interrelate with a variety of disciplines.

  1. Climate and Economic Justice Screening Tool by the White House Council on Environmental Quality (CEQ)
  2. EJScreen Environmental Justice Screening and Mapping Tool by the Environmental Protection Agency (EPA)
  3. CalEnviroScreen 4.0 by the California Office of Environmental Health Hazard Assessment (COEHHA)
  4. Aqueduct Water Risk Atlas by the World Resources Institute (WRI)
  5. Biodiversity Risk Filter by the World Wildlife Foundation (WWF)

Follow the blog and social for more Geography Awareness Week posts and events!


Like
1 People Like This Post

Peek at the Week: November 13

QUOTE OF THE WEEK

In Tim Burton’s Alice in Wonderland, The White Queen said, “You cannot live your life to please others. The choice must be yours.”

While being liked by others is undeniably important in life, living simply to please others can be a fraught, tiresome uphill battle. It’s incredibly difficult to keep up with trying to please everyone, and, at this point in the semester, that’s precious energy you might need to conserve.

It might be hard to make peace with, but understand that no matter what you do, there will almost always be one person who isn’t satisfied or has something negative to say. And, above all, make sure you’re making time to do the things that you love. You’ll be ultimately happier if you allow yourself to make the decisions that are right for you.


THIS WEEK AT FALVEY

Monday, November 13

Mindfulness Monday | 1-1:30 p.m. | Multifaith Prayer Room, St. Rita’s Hall | Virtual Option | ACS-Approved | Free & Open to Villanova Students, Faculty, & Staff

The Learners’ Studio/Center for Speaking and Presentation | 4-9 p.m. | Room 301 | Free

Tuesday, November 14

The Learners’ Studio/Center for Speaking and Presentation | 4-9 p.m. | Room 301 | Free

Wednesday, November 15

Fall 2023 Falvey Forum Workshop: Policy Map for Practical Purposes | 12-1 p.m. | Virtual | ACS-Approved | Free & Open to the Public | Register Here

The Learners’ Studio/Center for Speaking and Presentation | 4-9 p.m. | Room 301 | Free

Philosophy and Film Series on “Creativity and Madness”: Martin Provost’s Violette (2013) | 5:30 p.m. | Room 415 | ACS-Approved | Free & Open to Villanova Community | Light Refreshments Served

Thursday, November 16

2023 Outstanding Faculty Research Award Lecture: Dr. Elizabeth Burgess Dowdell | 1-2:30 p.m. | Room 205 | ACS-Approved | Free & Open to the Public | Light Refreshments Served

The Learners’ Studio/Center for Speaking and Presentation | 4-9 p.m. | Room 301 | Free

Sunday, November 19

The Learners’ Studio/Center for Speaking and Presentation | 4-9 p.m. | Room 301 | Free


HOLIDAYS THIS WEEK

Photo by Denise Jans on Unsplash

Today, Nov. 13, is World Kindness Day. If you’re feeling charitable, show someone in your life some kindness today, whether it’s a stranger in need of some help or somebody special in your life. Equally important, don’t forgot be kind to yourself today. We’re often our own worst critics, which isn’t entirely a bad thing, but giving yourself some grace is important.

Today also marks the beginning of Geography Awareness Week, a week dedicated to spreading awareness about the importance of geography. If you’re interested in celebrating this week, Falvey’s Digital Scholarship Lab has teamed up with the Department of Geography and the Environment to bring you some great events, which you can check out here. In between events, you can also test your geography knowledge by playing a round of Geoguessr.

If you want to experience the beauties of geography for yourself, National Hiking Day is this Friday, Nov. 17. If you need to de-stress with some physical activity and time outdoors, this is the perfect excuse. Need some local hike recommendations? Check out Falvey Graduate Assistant Rebecca’s “Cat in the Stax” installment on hiking trails around Villanova.

In the mood for a festive fall treat? This Saturday, Nov. 18, is Apple Cider Day. With the chilly weather on the forecast for this weekend, it’s a great opportunity to get cozy inside and enjoy this warm, quintessential fall drink.


Annie Stockmal is a second-year graduate student in the Communication Department and Graduate Assistant in Falvey Library.


Like
1 People Like This Post

Honoring Veterans with The Art of War

Art of War Event

Francis A. Galgano, PhD, Associate Professor, Department of Geography and the Environment, and US Army Lt. Colonel (Retired) with Ken DeTreux, MA, MPA ’18, US Marine Corps Colonel (Retired)


On Veterans Day, Villanova salutes our military veterans for their service and sacrifice at home and abroad.

In support of the current exhibit Art of War: Illustrated and Military Maps of the Twentieth Century, Falvey Memorial Library and the Office of Veterans and Military Service Members presented an exhibit talk and reception Nov. 9 in Falvey Library. Speakers discussed maps, their history, their use, and what the future holds for them in the military and beyond.


Like

Geo Week: Mapping Natural Gas, Aiding Developing Countries

Geography Awareness WeekRecognizing that young Americans have a gap in their understanding of geography and their roles as global citizens, National Geographic “created Geography Awareness Week to raise awareness to this dangerous deficiency in American education and excite people about geography as both a discipline and as a part of everyday life… Each third week of November, students, families, and community members focus on the importance of geography by hosting events; using lessons, games, and challenges in the classroom; and often meet with policymakers and business leaders.” 

 To celebrate Geography Awareness Week, Falvey Memorial Library and the Department of Geography and the Environment (GEV) invite you to attend this week’s geography-focused events, to check out our list of Geographic Information Systems (GIS) projects below, and to follow along with Falvey’s blogs sharing projects and discussions from GEV’s students. 

GIS Projects 

Today we talk about mapping natural gas infrastucture in GIS and how geography can aid developing countries.


Mapping Natural Gas Infrastructure in GIS

My name is Lloyd Willis, and I am a Villanova Alumni who graduated in the Class of 2020. I discovered an interest in Global  Interdisciplinary Studies (GIS) while taking classes in the Department of Geography and the Environment (GEV). The GIS specific classes that I attended during my time at Villanova made me realize I wanted to pursue I professional career in Geographic Information Systems in some form or another.

Currently, I am a GIS Technician II and a part of the AIS (Asset and Information Strategies) unit at an engineering consulting firm called Mott MacDonald. We use a GIS application called Smallworld, which is provided by GE Digital, a division of General Electric. Smallworld is widely known as the leader for GIS in utilities and communications. The work that we provide to our clients is updating natural gas main and fitting data from fields documents ranging from the 1940’s to present in the Smallworld GIS application to make the data more accessible and easier to manipulate. Since I began working at Mott MacDonald, I have been able to use GIS in new ways and in my everyday work. My work is specifically focused on the utilities side and involves editing data on maps for engineers to use in the field. This GIS work my unit does daily is crucial in correctly updating and manipulating data for engineers to conduct field work safely and efficiently. Without the use of the Smallworld GIS application, it would make the work of the engineers more complicated and dangerous. GIS allows the technicians to effectively and accurately edit thousands of feet of natural gas main data daily. Meaning we can produce large quantities of precise data to our client in a reasonable amount of time.

The utilities aspect of GIS is something I previously have not had much experience in. That being said, I continue to learn and understand how expansive the range of opportunities are in GIS fields and applications. I hope to continue my GIS journey and learn even more useful and practical skills in this field.

Lloyd Willis is a Villanova GEV undergraduate alum from 2020. He majored in Environmental Science and Geography.


Using Geography to Help Developing Countries

My name is Peter Nikitin, and when I tell people that I am a geography major their first reaction is “what are you going to do with that”, “that is a useless major, you should’ve majored in"GEV Logo" something that can get you a job and make you money”. These comments troubled me for a while, but I always had a strong passion and interest in geography and maps since I was 13 years old, and I never wanted to give that up. I was always able to absorb a wealth of information from simply looking at a map and see the value that most others don’t. Despite the question marks I trudged on in my academic career as a geography major at Villanova.

Deciding to follow my passion has paid off for me as I have learned a lot in the past 3 years of how geography and mapping skills can be extremely beneficial to the developing world. Through a friend at Villanova, I met someone who lit up when I told him how I was learning geography and how to make maps using the programs Arc Map and ArcGIS Pro. He explained to me how it’s such a great skill to have and how he is working in many countries around the world where geospatial software and mapping is highly in demand.

"Map image"He introduced me to a team of people in India that were working on creating child friendly villages. The goal of these villages were to stop child labor in the mines and ensure that 100% of the children had access to education. I used Arc Map to create a map of which villages have a child school enrollment rate less than 75%. This showed spatial patterns of which parts of this area had higher and lower rates of education access. This was extremely helpful to the team. Right now, we are in the planning stages for my senior project. We hope to find a spatial connection between child labor and deforestation to bring more awareness to the areas we are working in and hopefully gain the support of companies that see deforestation as an important issue. I am especially excited to become more involved because it is very fulfilling to use my skills to help create a better world for children in India.

This is a map I created for a class which shows deforestation in the state of Rodonia in Brazil and the spatial relationship deforestation has with official roads and urban areas. A map like this can help people decide on a area that should be a protected forest for example.

I also received an internship this summer through my major with Catholic Relief Services. I received a scholarship for holding this internship as well. Catholic Relief "Nature overhead shot"Services takes requests from all around the world for mapping projects on ArcGIS Pro and dashboards on Power BI. Using these programs helps bring data collected in the field to life and can help developing countries in seemingly endless ways such as disaster relief, planning, and making information more readily and easily available. As an intern, I am especially helpful to the program because I have access to technology that many people don’t, and I have the free time to work on projects that they’ve been unable to devote time to.

My main project has been using deep learning to identify and measure the diameter of tree canopies from drone imagery which would be used to calculate carbon sequestration in Madagascar. This model can tell people how much carbon is being stored in forests and show which areas are important to protect and preserve to mitigate climate change. It is important to know how much carbon is being sequestered when evaluating how much greenhouse gases are being released in an area. This project relies on user input to teach the software how to identify trees and measure the boundaries of them. I am very glad that I’m contributing to such a useful and interesting project, and I can’t wait to work on more projects like this in my career.

"Nikitin creating map of Madagascar"

Here is a picture of me using the software ArcGIS Pro to create a new map of Madagascar.


Peter Nikitin is a senior in Villanova’s Department of Geography and the Environment. He is majoring in Geography.


Like
1 People Like This Post

Geo Week: Geospatial Tech for the Military, GIS and the Environment

Geography Awareness WeekRecognizing that young Americans have a gap in their understanding of geography and their roles as global citizens, National Geographic “created Geography Awareness Week to raise awareness to this dangerous deficiency in American education and excite people about geography as both a discipline and as a part of everyday life… Each third week of November, students, families, and community members focus on the importance of geography by hosting events; using lessons, games, and challenges in the classroom; and often meet with policymakers and business leaders.” 

 To celebrate Geography Awareness Week, Falvey Memorial Library and the Department of Geography and the Environment (GEV) invite you to attend this week’s geography-focused events, to check out our list of Geographic Information Systems (GIS) projects below, and to follow along with Falvey’s blogs sharing projects and discussions from GEV’s students. 

GIS Projects 

Today we talk about geospatial technology for the military and using GIS and geography to solve environmental problems.


Geospatial Technology for the Military

My name is Kylee Giblin, and I am currently using Global Interdisciplinary Studies (GIS) for a job I got after graduation with Naval Information Warfare Center Pacific (NIWC). Because of my GIS experience during undergrad I was able to get hired as a beginning GIS Technician. Currently I have been converting computer-aided design (CAD) documents into ArcGIS Pro for telecom data for various infrastructure areas on the island. This might sound confusing (it was to me too)! The maps we make show manholes and telecom or electrical lines that connect to the manholes. GIS work is important for this because we need to know where the communication lines lie in cases of emergency. The maps are also important for having the exact location of cables etc. in order to fix them or to check them. The job isn’t just computer restricted, we need to go into the field and physically GPS where the manholes and other data are so that when referring to the maps, they are correct.

Though this work is not environmentally focused, I am able to learn a lot about GIS tools that I could apply to future work. I am also learning about the land where I am from and the military areas that I did not know before.

Kylee Giblin is a Villanova GEV undergraduate alum from 2021. She majored in Environmental Studies.


Geography and GIS Help Solve Environmental Problems

My name is Caroline Dimich, and I am a recent graduate of Villanova’s department of Geography and the Environment (GEV). I double majored in Environmental Studies and Geography. I believe that studying geography was extremely beneficial to my education because it led me to understand how everything can be connected, even if it is far apart. I explored many different courses where geography was an undertone topic and I truly got to see how the world works with the meshing of cultures, people, and physical landscapes. I am grateful to the GEV department for inspiring me to learn more about my passion in geography in thought provoking classes with incredible concepts that made coming to class everyday exciting.

For my senior project I was lucky enough to work with Professor Jen Santoro and use Geographic Information Systems to look at a spatial problem that I find important. I completed a Multi Criteria Decision Analysis looking at the state of Montana and understanding its wind energy potential to see where future wind farms could be located. The issue of renewable energy is extremely important as the world faces the impending climate crisis. I grew up in Montana where I have been inspired by the differing landscapes and seeing how dependent the states is on Fossil Fuels while there is such a large potential for renewable energy to be captured. In this study I gained GIS and research experience while being able to locate large amounts land to capture enough wind energy to power the entire United States. This was an incredible opportunity to work with Professor Santoro and learn more about my home state as well as seeing a positive future for renewable energy.

After graduating from Villanova, I had the opportunity to intern with Catholic Relief Services (CRS) as a Data and Geospatial Analyst. During the three month internship I worked with people all over the globe who had one common goal which was to help people who were less fortunate and to make the world a better place. I had two main projects that I worked on throughout my time with CRS. The first project was to look at watersheds in Sierra Leone, Africa and determine areas that were at high risk for flooding in future rain events. This process would eventually be used to determine flooding risk in other areas of the world. The second project I worked on was understanding a GIS model that a Villanova research team had created to find areas in countries after natural disaster events. This model was very intricate and took many hazards and compared them to find areas of high risk. The model then looked at necessities that humans need such as healthcare, transportation, and land cover to determine where shelters must be located after natural disasters. This model will also be used in other areas of the world to help response teams act quickly in the event of a disaster to save as many people as possible.

In both my senior project as well as my internship I have learned why geography and tools such as GIS are important to the future of this world. Not only can the study of geography help bring people together around the world, but it can also help students understand how they can create a better place to live. I cannot express my gratitude to the GEV department for helping students such as myself expand their knowledge and want to help others.

Caroline Dimich is a Villanova GEV undergraduate alum from 2021. She majored in Environmental Studies and Geography.


Geography and GIS in Urban Environments

How do you use geography/GIS in your work or research?

My name is Kate Homet, and I use GIS everyday in my own thesis work, but also for my classes! I’m in my second year here at GEV in the MS program and my thesis research utilizes GIS and spatial data to create a spatial model to help make the planning of green stormwater infrastructure across Philadelphia more equitable in terms of mapping social, infrastructural, environmental, and maintenance vulnerabilities. To do this, I use social demographic data and display it spatially by census block group, map the location of 10-year, 24-hour design storm flood inundation, utilize city parcel data to map which buildings are susceptible to flooding, and model where stormwater infrastructure maintenance impacts such as litter, leaf litter, and sediment tend to build up across the city.

"A map showing the severity of leaf litter buildup across the city based on data from foliage dropping in the 2018-2019 season in Philadelphia"

"A map showing the severity of litter buildup across the city based on data from the city’s Litter Index for 2018"


"Description of map images"

Not only am I using GIS and geography for my research, but I also use it in most of my classes as well! It is such an awesome tool to have in my toolbelt because it can be used for a variety of different purposes and in so many disciplines.

"image of map"

I use it in Remote Sensing with Professor Kelley to interpret satellite imagery, I used it in my Drones course with our GIS whiz Michele Gandy and Professor Strader, to download and analyze drone footage, and I used it in my Wetlands course with Dr. Weston to map marsh sites and sediment accretion. And that is only what I did this semester!

Why is geography/GIS important to the work you do?

The ability to understand the spatial relationships in the world around you is crucial. Whether you’re planning to move to a new city, and you need to know where you can get groceries, or you’re looking for a new hiking path to try, you will always be utilizing some sort of geographic information to navigate through life. The work I’m doing now is adding to my toolbox of GIS skills and spatial modeling, something I hope to bring into my future career modeling flooding and planning for climate change adaptation. If you haven’t already taken a class in GIS, I highly suggest it. Our program may seem difficult at first, or it may come as second nature to you, but having those baseline skills in GIS will come in handy one day, no matter what discipline you’re in.

Kate Homet is a Villanova GEV Masters of Science in Environmental Science (MSES) graduate student. She is working with Dr. Peleg Kremer.


Like

Geo Week: Geography and Communications, GIS for Wildlife Ecology

Geography Awareness WeekRecognizing that young Americans have a gap in their understanding of geography and their roles as global citizens, National Geographic “created Geography Awareness Week to raise awareness to this dangerous deficiency in American education and excite people about geography as both a discipline and as a part of everyday life… Each third week of November, students, families, and community members focus on the importance of geography by hosting events; using lessons, games, and challenges in the classroom; and often meet with policymakers and business leaders.” 

 To celebrate Geography Awareness Week, Falvey Memorial Library and the Department of Geography and the Environment (GEV) invite you to attend this week’s geography-focused events, to check out our list of Geographic Information Systems (GIS) projects below, and to follow along with Falvey’s blogs sharing projects and discussions from GEV’s students. 

GIS Projects 

Today we talk about the links between geography and communications as well as GIS for wildlife ecology.


Geography & Communications, Closer Than They Appear


Geography and communications—at first glance, the two fields seem unrelated. However, since beginning my Communications internship at the nonprofit EcoAgriculture Partners, I realized that these two fields are involved in a mutually beneficial relationship.

Working in communications necessitates understanding the audience’s needs and wants. Consequently, geography plays an integral role in understanding the motivations of your audience. As a communicator, I must consider the location of our global partners and stakeholders. Factoring in global audiences requires an inclusive communication strategy. For instance, even something as simple as providing multiple time zones for an event helps supporters better understand our intent and the information we are providing.

Though I do not directly utilize technical geography or GIS skills in my job, my background in these areas translates well into the responsibilities needed for my current position. Spending my junior and senior years at Villanova learning how to design the perfect map blossomed into a passion for designing communicable graphics. The storytelling skills I built in my geography classes and through the creation of StoryMaps gave me the confidence to write compelling stories about the global work EcoAgriculture does. My geography and GIS classes laid the foundation for skills like attention to detail, creativity, and storytelling, all of which I use every day in my role.

In the course of my internship, I plan to utilize my GIS abilities through developing StoryMaps and maps to communicate the results of future field research projects. I am excited to tell these stories by combining old and new skills. At present, I am working on a long-term project of documenting the history of our organization, which will hopefully allow me the opportunity to illustrate a larger geographical picture of the work EcoAgriculture Partners has done for over two decades.

Geography and GIS, while appearing as specifications, are valuable to a plethora of fields. I am so grateful I took advantage of the opportunity to study these areas in-depth while at Villanova which allowed me to take away such beneficial skills. As a grateful alum, I’m wishing everyone a Happy Geography Awareness Week & GIS Day!


Delaina Castillo is a Villanova GEV undergraduate alum from 2021. She majored in Environmental Studies and Art History.


GIS for Wildlife Ecology

Geography has been a key component of my ecological research, allowing me to analyze data and visualize trends in new ways. In the summer of 2020, I lived at Sevilleta National Wildlife Refuge studying species distribution of large mammals living there. I used data from a long-standing camera trap network to analyze how species such as mule deer, elk, oryx, coyotes, bobcats, and mountain lions are spread across the refuge and use the available water sources. Geography and GIS made my participation in this project possible and allowed me to perform some cool analyses.

""

The first question I asked was if water visitation varied spatially or temporally based on average precipitation or temperature. To do this, I used the GPS location of all of the camera traps and collected precipitation and temperature data from LANDSAT. With this, I was able to study how different species reacted differently to their environment. All species reacted pretty similarly to precipitation—all visiting perennial water sources more frequently in drier weather. When looking at temperature, however, the different species reacted in the distinct patterns; bobcats, elk, and mule deer all used perennial water sources more at higher temperatures. Coyotes and pumas utilized perennial water sources at similar levels across all temperatures—which makes sense as they gain a lot of their water from predation. Oryx showed distinct peaks at each extreme temperature—likely resulting from their adaptations to extreme aridity from evolving in arid regions of Africa.

""

My final research question was asking what habitat characteristics determined optimal habitat for large mammals on the refuge. For this, I modeled optimal habitat for mountain lions based on methods from previous papers. Using land cover, slope, and ruggedness layers, I was able to create a model for suitable mountain lion habitat. I then compared this model to the camera trap dataset and the sites modeled as good habitat had noticeably more mountain lion occurrences. Finally, I paired the camera trap dataset with fieldwork hiking over the refuge and taking GPS coordinates for tracks and scat of large mammals to carry out a Maxent analysis of species distribution. Geographical analysis enabled me to study ecology on a larger scale, giving me tools to research population-wide trends. Most of the research methods I used for this were methods I learned in my coursework at Villanova, during multiple GIS and remote sensing classes. Geography has given me a research skillset distinct from pure ecologists and biologists—leading to some really cool opportunities like this!


Alec Henderson is a senior at Villanova. He is majoring in Environmental Science.


Like

Geo Week: Geography and Health; Geospatial Analysis; and GIS and Environmental Security

Geography Awareness Week

Recognizing that young Americans have a gap in their understanding of geography and their roles as global citizens, National Geographic “created Geography Awareness Week to raise awareness to this dangerous deficiency in American education and excite people about geography as both a discipline and as a part of everyday life… Each third week of November, students, families, and community members focus on the importance of geography by hosting events; using lessons, games, and challenges in the classroom; and often meet with policymakers and business leaders.” 

 To celebrate Geography Awareness Week, Falvey Memorial Library and the Department of Geography and the Environment (GEV) invite you to attend this week’s geography-focused events, to check out our list of Geographic Information Systems (GIS) projects below, and to follow along with Falvey’s blogs sharing projects and discussions from GEV’s students. 

GIS Projects 

Today we talk about geospatial analysis in the utilities industry, urban geography’s impacts on human health, and how geographic information system (GIS) goes hand-in-hand with environmental security.


Geospatial Analysis in the Utilities Industry

Since graduation, I have been working as a Business Analyst in the Consulting division of Primera Engineers. As consultants, we provide a variety of services for our clients, from GIS work to project management, often for gas and electric utility companies.

One of my projects currently underway leverages high-accuracy GPS technology to locate gas utility pipelines with sub-inch accuracy, enabling our team to revise historical sketches in GIS and collect data detailing the pipeline materials, assets, and locations. This information is vital to preventing pipeline damages during construction, and improves the utility’s ability to find, repair, and replace its pipelines.

Another of my primary projects is reviewing and revising the emergency response plan for one of our gas and electric utility clients. Responding to a gas event incorporates core geographical questions, such as where, when, why, and how the emergency occurs. In the emergency response plan, my team accounted for severity, event type, procedures, notifications, and other factors while simultaneously streamlining the plan. The process of developing a clear and efficient response plan often utilized the skills I developed through my geography classes, where my course work often focused on connecting diverse details through time and place.

One of the most geographically applicable events is storm response.  Mid-Atlantic gas and electric utilities exist at the nexus of two storm systems, where tropical storms from the Gulf Stream and Canadian Nor’Easters can deliver intense rain and snowstorms. Preparing for a storm emergency in the Mid-Atlantic is innately geographical, as it hinges upon utilities’ locality and how weather patterns impact the area they service. Storm response begins before the storm arrives, with gas and electric utility companies conducting pre-planning meetings to prepare for landfall. In a changing climate environment that forebodes more frequent and intense storm systems, a timely and effective emergency response plan is vital  — enabling utility companies to prepare for climate events and better service their customers.

These projects are only two examples of the work I do at Primera. I have had the opportunity to work on a variety of projects that tap into my geographical skills. I particularly enjoy observing how different projects connect with each other through common goals, regulations, best practices, and more. At work, I often find that I am thinking holistically, a skill that I honed studying geography. I connect my work across utilities, technologies, processes, communications and more, working with my team to advance our clients’ goals.


Annelise Laughlin is a Villanova GEV undergraduate alum from 2021. She majored in Geography and Communication and was a 2021 Falvey Scholar.


Urban Geography Impacts Human Health

At present, just over half of the world’s population lives in cities; by 2050, two out of three people will call a city their home. As urban populations grow at a rapid pace, it becomes increasingly important to consider air quality and the impact that it has on human health. Though great strides have been made in recent years to ensure that people have access to clean air, air quality management can still be quite difficult in cities. After all, cities are very complex environments; many potential sources of air pollution exist (traffic, industry, and energy production just to name a few…), and the impact of each of these sources can change depending on the time of day and where they’re located in the urban environment. In order to effectively address air quality issues worldwide, we need to know when – and where – air pollution poses the greatest risk to people.

Where in the city does air pollution pose the greatest threat to human health, and what can we do about it?

To this end, I have been conducting research in Philadelphia in conjunction with Drs. Peleg Kremer and Kabindra Shakya to find where and when concentrations of air pollutants – specifically, fine particulate matter (PM2.5) – are highest. Using a van equipped with GPS and air pollution monitors, we drove more than 300 miles throughout Philadelphia and collected over 400,000 data points to gain a deeper understanding of PM2.5 concentrations than is possible with conventional monitoring methods.

""

Gearing up for the first of many drives in Philadelphia!

""


Through our mobile monitoring campaign, we found that the highest PM2.5­ concentrations were measured in the North Delaware and River Wards planning zones. However, knowing where these concentrations are highest is only half the battle; we also need to consider why concentrations are elevated in these areas. With high resolution land cover raster data combined with parcel data from the City of Philadelphia, we were able to lend essential spatial context to our air pollution data. Ultimately, we found distinct relationships between particulate matter concentrations and specific urban structure patterns. By identifying urban structure patterns that could potentially contribute to higher levels of particulate matter pollution, we can help city planners and officials make more effective policy and design choices to improve air quality as cities like Philadelphia continue to grow and develop worldwide.

If you would like to learn more about air pollution in Philadelphia and how the urban environment can influence air quality, feel free to check out my research articles, Mobile Monitoring of Air Pollution Reveals Spatial and Temproal Variation in an Urban Landscape and Predicting citywide distribution of air pollution using mobile monitoring and three-dimensional urban structure!


Lucas Cummings is a Villanova GEV Masters of Science in Environmental Science (MSES) alum from 2021.


GIS Goes Hand-in-Hand with Environmental Security

My name is Justin Weber, and I am a second-year master’s student here in GEV. I am currently finishing up my program and am preparing to defend my thesis in November 2021. GIS and geography are central to my research. My research is based in environmental security, a field that examines how climatic and environmental factors influence the development, outbreak, and resolution of both peaceful and violent conflicts across the world. Environmental security lends itself to inter-disciplinary collaboration, connecting subjects like political geography, ethnography, remote sensing, and physical geography. Tabular records, interviews, climatic data, and other data can all be integrated to examine the relationship between environment and conflict. In my thesis, I explored the relationship between land quality and violent conflicts between farmers and herders in Nigeria. These conflicts pose a grave human and economic risk to many people in Africa’s largest and fastest growing country. My goals were to examine if, and to what extent, changing climate influenced the development of conflicts.

Within this project, I operated almost exclusively in ArcGIS Pro with a variety of different data types and datasets. Land quality data were created from remotely sensed vegetation and precipitation data. GIS was immensely valuable because it allows analysts to take news reports of conflicts and geolocate them for analysis. Conflict data were integrated from three independent data sets and combined into a single, ArcGIS feature class, which was easy to analyze using spatial tools in ArcGIS. I then used GIS tools to combine land quality variables with conflict events. From this synthesis of data, I examined previously unknown spatial and temporal patterns. Hopefully, my research can be used by other researchers and policy makers to better protect at risk populations across Africa.

None of the spatial or temporal analysis I conducted during this research would be possible without GIS (at least in a reasonable amount of time!). Thanks to previously developed scripts, tools, and software like ArcGIS and others, I was able to sort through and analyze thousands of conflicts. Additionally, I could examine large geographic areas and integrate twenty years of vegetation and rainfall data into my analyses. Modern GIS allows me and other researchers to explore spatial problems from an analytical framework and at a scale that we have never had before. Additionally, many GIS offer users the ability to create their own tools and programs that integrate into the software. The computing power, flexibility, and analytical value of GIS make them useful for a multitude of academic disciplines.

Map showing All conflicts and resulting deaths from April 2000 to March 2020 within the Middle Belt of Nigeria.

All conflicts and resulting deaths from April 2000 to March 2020 within the Middle Belt of Nigeria.


Justin Weber is a Villanova GEV Masters of Science in Environmental Science (MSES) graduate student. He is working with Professor Frank Galgano, PhD.


Like

Geography Awareness Week

Geography Awareness WeekRecognizing that young Americans have a gap in their understanding of geography and their roles as global citizens, National Geographic “created Geography Awareness Week to raise awareness to this dangerous deficiency in American education and excite people about geography as both a discipline and as a part of everyday life… Each third week of November, students, families, and community members focus on the importance of geography by hosting events; using lessons, games, and challenges in the classroom; and often meet with policymakers and business leaders.” 

 To celebrate Geography Awareness Week, Falvey Memorial Library and the Department of Geography and the Environment (GEV) invite you to attend this week’s geography-focused events, to check out our list of Geographic Information Systems (GIS) projects below, and to follow along with Falvey’s blogs sharing projects and discussions from GEV’s students. 

GIS Projects 

Today we talk about GIS for city planning and the robust internship opportunities available in this field.


GIS for City Planning

""My name is Charlotte Shade ’19 MSES, and I am currently a data analyst for the City of Boston. The main goal of my position is to help other city departments serve the public. I use GIS and other ESRI products almost daily!

One of my first projects at the City was to help our Parks and Recreation Department build an asset inventory system. The Parks Planner I was working with needed to map the location of all the park assets (playgrounds, benches, sports fields, etc.) and document information about each asset (age, handicapped accessible, etc.). This project was large, and we used ArcGIS Pro, GIS Online, ESRI Web Apps, and more to build and sustain the asset inventory system. After asset locations were plotted, an ESRI web app was built to allow Parks project managers to review the asset points in each park. Once assets are marked as “correct,” the points are automatically displayed on the public-facing map. The public asset inventory map is hosted on an ESRI Hub site where Boston residents can find sports fields, playgrounds, and handicapped accessible parks in their neighborhoods.

As Boston neighborhoods gentrify and housing prices increase, equitable development is an important issue for Boston residents. To help make the process of granting building permits more transparent, I worked with Boston’s Inspectional Services Department (ISD) to build the Zoning Board of Appeals (ZBA) Tracker map. ISD is tasked with ensuring compliance with the City’s zoning code. If an application for a permit is refused because of a zoning violation, applicants can appeal the decision to the ZBA and ask for an exception. If the ZBA grants the exception, then the applicant can continue with the process of obtaining a building permit. Citizens can use the ZBA Tracker to identify zoning appeals in their neighborhood and learn what step the appeal is in in the process. The ZBA Tracker was built by plotting automated application data from ISD in a GIS Online map, adding that map to an ESRI web app and then embedding the interactive web app into an ESRI Experience site where citizens can go to use the Tracker and learn about the ZBA process.

Maps are a vital communication tool for the City of Boston. We build maps so citizens can easily locate important resources near their homes, such as farmers markets, COVID-19 vaccine locations, age-friendly walking trails, voting locations, public art sites and so much more! GIS allows my team to provide Boston’s citizens with the critical information they need every day.


Charlotte Shade is a Villanova GEV Masters of Science in Environmental Science (MSES) alum from 2019.


Geography and GIS Provide Great Internship Opportunities

 My name is Zach Silberman, and I am a current senior at Villanova University studying geography with a minor in public administration and sustainability studies. Throughout my time here, geography and specifically GIS has played an integral role in a vast majority of my academic work, research, and external internship opportunities.

This past summer, I was grateful enough to be selected for an National Science Foundation-funded grant opportunity with Citizen Science GIS in partnership with University of Central Florida as a GIS researcher. Through the program I worked on a team of college students from across the U.S. participating in community-based GIS, youth education, and research. Specifically, my team looked at flood analysis, mitigation efforts, neighborhood resilience, and using local perceptions and voices to tackle these particular issues in Hopkins; a small village along Belize’s eastern coast. A particularly tough challenge we faced was drafting a GIS plan with community partners to provide relief efforts and infrastructural solutions to a place we had personally never stepped foot in due to the COVID-19 pandemic. Instead of looking at technical solutions, we instead turned to science communication strategies, focusing on the relaying of geography, drones, and GIS as a tool  for youth within Hopkins to fix local problems.

Besides my professional work, I find that studying geography has allowed me to view the world around me in a new lens. As someone who is fascinated by both the natural and built environments, I have found a newfound appreciation for the interconnectedness between the two. Having had the opportunity to do field work ranging from the woods around campus to GPS appendaging of buildings within center-city Philadelphia, I have no shortage of real-world experience that has shaped how I view each and every place I visit. It is not to be understated how deep professions like GIS, remote sensing, or planning can go if you’re eager and willing to learn, and how applicable the things you may learn in your four years here are in virtually any career or field.

Zach Silberman is a senior in Villanova’s Department of Geography and the Environment. He is majoring in Geography.


Like

Join Falvey Memorial Library for Geography Awareness Week Events

Geography Awareness Week begins Monday, Nov. 15. Established by a presidential proclamation more than 25 years ago, National Geographic created the annual public awareness program to demonstrate the importance of geography. From National Geographic: too many people are “unable to make effective decisions, understand geo-spatial issues, or even recognize their impacts as global citizens.” Aiming to raise awareness of these issues, more than 10,000 Americans participate in Geography Awareness Week (Nov. 15Friday, Nov. 19) annually. Join Falvey Memorial Library, the Department of Geography and the Environment, the Department of History, and Gamma Theta Upsilon (GTU) for these Geography Awareness Week events:


Undergraduate Research Symposium Poster Display (Monday, Nov. 15Friday, Nov. 19)

Falvey Memorial Library’s Digital Scholarship Lab and Room 205; 8 a.m.5 p.m.

Please visit Falvey Memorial Library’s Digital Scholarship Lab and Room 205 to view student posters from the Villanova Student Undergraduate Research Symposium. Check out Falvey Memorial Library’s blog to view daily posts from current and former GEV students on their past GIS mapping and geography projects!


Falvey Forum: Creating Interactive GIS Maps with Leaflet and R (Wednesday, Nov. 17)

Virtual Workshop; 12:301:30 p.m. 

Join Erica Hayes, Digital Scholarship Librarian, on Wednesday, Nov. 17, 12:30–1:30 p.m. for a virtual workshop entitled “Creating Interactive GIS Maps with Leaflet and R.” You’ve likely used ArcGIS Online to display maps online, but have you considered using free and open-source tools for web mapping? Leaflet is one of the most popular open-source JavaScript libraries for creating interactive maps. Here’s an example Interactive Map Tracking Charges & Enforcement Related to Covid-19 created with Leaflet by two researchers in Canada. This workshop will introduce you to Leaflet for R (a statistical programming language), an R package, which makes it easier to integrate and control Leaflet maps.

REGISTER HERE. A Zoom link will be sent to registrants one day prior to the workshop.


GIS Day Lecture: Signe Peterson Fourmy, JD, PhD, Villanova University, on “Digital Mapping & Last Seen Ads”  (Wednesday, Nov. 17)

Virtual Workshop; 5:30–6:30 p.m.

Please join us virtually on Wednesday Nov. 17, 5:30–6:30 p.m. as Signe Peterson Fourmy, JD, PhD, Director of Research and Analysis of the “Last Seen: Finding Family After Slavery” digital humanities project, will be discussing mapping the ads of formerly enslaved people after emancipation.

Formerly enslaved people placed thousands of “Last Seen” ads in newspapers after emancipation searching for family and friends. By mapping these ads, the “Last Seen: Finding Family After Slavery” project makes visible the forced dislocations that not only reflect the personal loss and trauma of slavery but also the geographic impact of the Domestic Slave Trade and post-emancipation migration. This interactive GIS mapping feature of the project allows users to visualize how this displacement affected individuals, when they and their loved ones were sold, and to explore the origins of those who formed post-war Black communities.

Biography:

Signe Peterson Fourmy earned her JD from the University of Houston Law Center in 2001 and her PhD in History at the University of Texas at Austin in 2020. Currently, she serves as the Director of Research and Analysis at Villanova University for the digital humanities project, “Last Seen: Finding Family After Slavery.” She is also a lecturer in the Department of History at UT Austin.

REGISTER HERE


GTU Honor Society Talk & GEV Colloquium Lecture: Gordon Coonfield, PhD, on “How Neighborhoods Remember: Mapping Memory and Making Place in Philadelphia” (Thursday, Nov. 18)

Mendel Science Center, Room 154 and Virtual Livestream; 5:306:30 p.m. 

Join us on Thursday, Nov. 18, 5:30–6:30 p.m. in Mendel Room 154 or register virtually as Gordon Coonfield, PhD, Department of Communication and Media Studies will be discussing his mapping project: Kensington Remembers.

Biography:

Gordon Coonfield, PhD, Associate Professor of Communication at Villanova, utilizes multimedia to document the ways in which changes to the built environment impact cultures of memory. His Kensington Remembers project incorporates story mapping, photography, and ethnographic writing to explore vernacular memorial sites in one of Philadelphia’s most impoverished neighborhoods.

 REGISTER HERE.


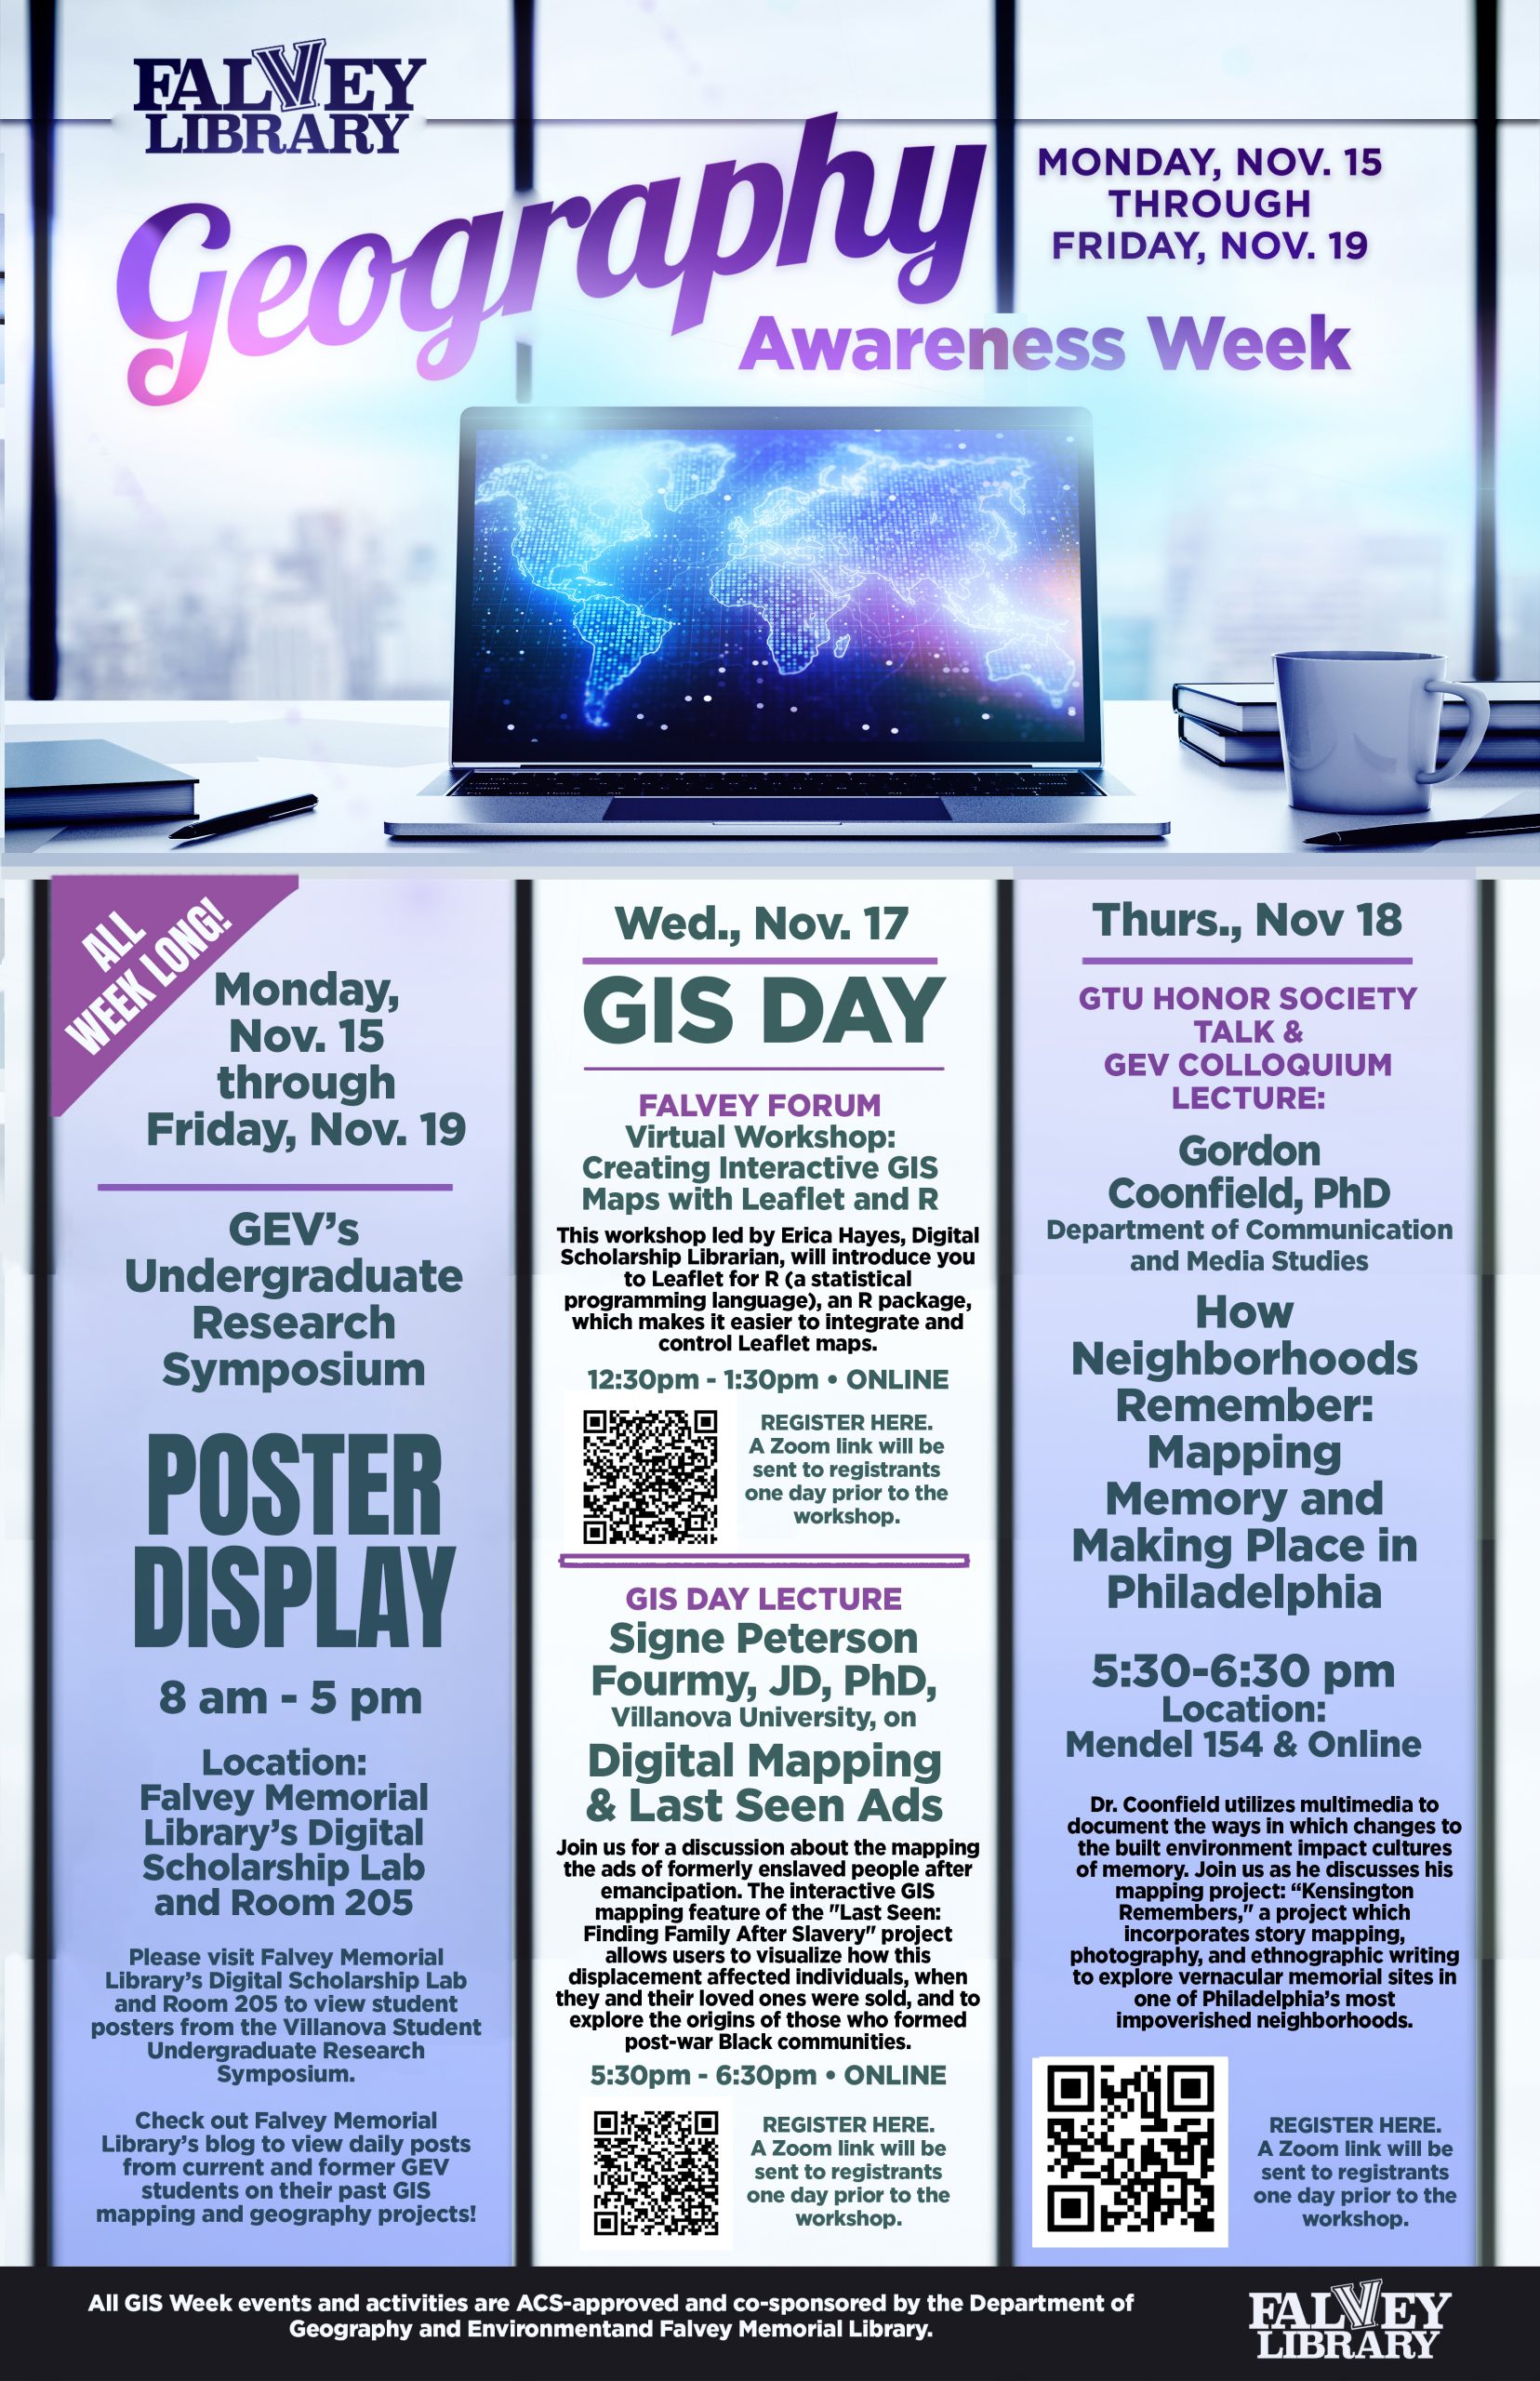
Kallie Stahl ’17 MA is Communication and Marketing Specialist at Falvey Memorial Library.


Like


Last Modified: November 11, 2021

Ask Us: Live Chat
Back to Top